


Forum topic: New chance to comment on Fox Lane LTN
New chance to comment on Fox Lane LTN
Adrian Day
19 Nov 2021 09:58 #6238
- Adrian Day
-

Share
![]()
![]() Share by email
Share by email
Please Log in or Create an account to join the conversation.
New chance to comment on Fox Lane LTN
Peter Payne
20 Nov 2021 02:49 #6242
- Peter Payne
-
Share
![]()
![]() Share by email
Share by email
I dont need more data nor have I ever said I need more data. I know the answer because I bothered to find out to see what the effects the LTN would have on pollution and greenhouse gases. You are the ones driving this scheme, pretending its good for the environment, and you haven't bothered to find out, yet its critical as to how much traffic you would have to remove to active travel to compensate for the extra pollution you are creating.
Maybe Karl knows the answer, but his comment "However I doubt if marching for the right to drive anywhere to save the planet will cut it with any thoughtful observer, even were it not the week after COP26 with the highlighting of carbon associated catastrophes and need for fundamental lifestyle change." suggests he hasn't bothered to find out either. The point is Karl, any "thoughtful observer" would check statistically whether the methods used to remove traffic are likely to work for or against carbon associated catastrophes.
You also have not commented on the maths or logic in #6213 explaining why the congestion hasn't disappeared as you were led to believe it would.
Please Log in or Create an account to join the conversation.
New chance to comment on Fox Lane LTN
Karl Brown
20 Nov 2021 09:00 #6243
- Karl Brown
-
Share
![]()
![]() Share by email
Share by email
You seem to have bucketed all pollutants as one. You should separate the key ones: NOx’s, PM’s , CO2 and noise. Each has, often very, different causes, impacts and distributions. You will need to consider interior LTN, boundary LTN and non LTN aspects for impacts. For this latter analysis population locations and their densities will be a necessary factor. Duration will be key because things change and it’s unlikely a single choice of duration will be enough for a sensible conclusion. Then once you are into duration the issue of human behavioural factors and specifically behavioural change will need to be assessed. That in turn will be impacted over time by separate changes, eg Haringey’s proposed LTNs, less trains, better bus lanes. And as we delve deeper into a complex dynamic system there will be more. But just a few examples of impact in the above vein:
Take one street, my own, and the last 2 months alone three cars have been given up. That’s 100% car travel impact.
Take a resident form the next street along and A406 congestion (some might say Bowes LTN causal) was so bad that a weekly trip to Leyton is now undertaken by public transport (2 trains). There will be X% equivalent >2km journeys of such form, and I imagine not only for residents intra the LTN.
Noise is either engine or tyre or both, with a switch to which is the most pronounced over at speeds differing by vehicle. How does that play for a car barrelling down Amberley vs one moving slowly on High Street. What distribution of (harmful) impact to what level of population?
PMs are primarily brake and tyre wear and so similarly, what impact on those of slowing cars on boundary roads vs ones barrelling down eg Amberley?
How does auto engine switch off when stationary and the need for drivers to switch off when an auto facility is not available play out on boundary road pollution. Does it vary by junction and / or time of day?
Does the less but bigger junctions of the boundary have a different pollution profile to the more but smaller junctions of intra lTN journeys? How does that differ for each
Outside of the LTN on the boundary Southgate 5 ways is a highlighted issue. Three streets are LTN independent: has incoming traffic dropped, why if so? What about their outgoing traffic.
Are any of the conclusion different for drivers in vehicle vs the considerable numbers non drivers?
And so on.
It’s probably worth pointing out that it’s not Adrian Day introducing LTN’s rather its government policy (and money), supported by the London Mayor and his Transport Strategy and ultimately Ensiled Council in this case – and numerous councils similarly across the country. It’s a big, complex, changing world.
Please Log in or Create an account to join the conversation.
New chance to comment on Fox Lane LTN
Adrian Day
20 Nov 2021 12:50 #6244
- Adrian Day
-
Share
![]()
![]() Share by email
Share by email
Please Log in or Create an account to join the conversation.
A plaza for PG?
Adrian Day
20 Nov 2021 15:46 #6245
- Adrian Day
-
Share
![]()
![]() Share by email
Share by email
Please Log in or Create an account to join the conversation.
New chance to comment on Fox Lane LTN
Peter Payne
21 Nov 2021 03:03 #6246
- Peter Payne
-
Share
![]()
![]() Share by email
Share by email
Karl, yes the statistics I have given here are a simplified metric of a complex dynamic system, this is a general forum after all and not everyone would be able to comprehend the multitude of variables that would be required to give absolute answers. I have, for simplification, “bucketed all pollutants as one”. But it’s clear that if a car does a 5km journey that takes ten minutes and the next day does the same journey but it takes twenty minutes that the second journey would produce more of ALL the pollutants. Not necessarily twice as much and yes it will vary according to the pollutant, whether you have automatic cut out when stopped, engine temperate and speed etc. so working out exactly for each pollutant is complicated, but it will ALWAYS be more. So although I am not claiming an all encompassing answer (a Douglas Adams 47 you said, I think you mean 42) I am claiming all these dynamics relating to exhaust emissions can be reasonably reduced to be proportional to time on the road with engine running. Brake and tyre wear would be more directly proportional to journey length, speed and amount of braking, but since traffic that has been diverted around an LTN rather than taking the more direct (ie shorter and more environmentally friendly route) one would expect an increase here too, though probably not as great and may be met if there was sufficient evaporating traffic. The problem is, what is sufficient evaporating traffic. In the example I gave in #6312 I removed 90% of 2km traffic and showed how it was impossible to remove this by road closure and not increase net pollution. Your point being taken maybe I should refer to this as net exhaust pollution, but I think you and everyone else knew what I was referring to.
The one dynamic you did not refer to was the build up of exhaust pollution in non or slow moving traffic. As you know moving traffic disperses the gaseous and particulate pollution as it distributes it initially over a wider area and the following cars produce moving air which disperses the pollution. Idling and slow moving traffic allows the pollutants to build up way above the background dispersed levels, even into the three figure ug/m3 levels which are far more dangerous to people with respiratory conditions. This is exactly what the LTNs are doing.
I will return to your other points at a later date or else this will turn into a essay rather than an post, suffice to say here the figures are looking at the overall net effects and clearly they will differ inside LTN, on boundary roads and further affected roads, and there will be areas unaffected by local traffic changes, though all areas will be ultimately affected by the Greenhouse Gas issues. The benefits will largely be obtained inside the LTN and the detrimental effects outside.
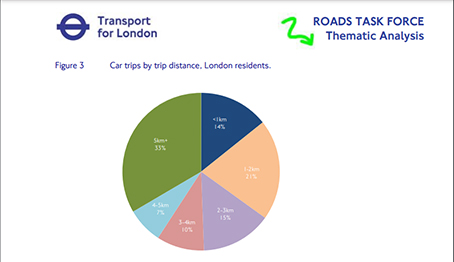
But now to return to Adrian’s rebounded request, what’s proportion of traffic is made up by cars doing 2km or less journeys. We know this target group for active travel constitutes 35% of car trips. In fact the three grades of trip lengths fall quite nicely, if approximately into thirds. The often produced TfL pie chart (attached) shows that roughly another third of car trips fall into the group of 2-5km and the top third of car trips, over 5km. Because TfL produce a breakdown per km grouping we can see the short journeys average approximately 1.6km, the medium length journeys about 3.4km, but TfL give no breakdown of journey lengths above 5km so what is the average here ? They just say this third of traffic is doing trips longer than 5km. Now we can work it out, which I did, but wanted to confirm this with TfL, which they eventually did. Their London Travel Demand Survey 2020 showed the average for the group of cars doing above 5km is 17km, I repeat that’s the AVERAGE.
I asked for a link for where this is published and they couldn’t supply one because they haven’t published this fact (I wonder why?) they just gave me the table from the survey breaking down this group and said they couldn’t direct me to the actual survey data due to “data protection rules”.
So a car on a long journey (ave 17km) is on the road over 10.5 times longer than a car on a short journey (ave 1.6km) so constitutes over ten and a half times more of the car traffic. The medium journeys take over twice as long as the short ones so for every 13.5 cars on the road at any one time only one is on a short car trip. That’s a bit over 7%.
But this is only short journey cars as a proportion of cars, not of total traffic. Add in the HGV’s , LGV’s, buses and taxis etc. and you find cars nowadays make up around around 75% of total traffic (used to be around 80% but there been a substaintial increase in LGVs due to supermarket and internet deliveries) this 7% figureas a proportion of cars reduces to around 5% as a proportion of total traffic.
So here’s our answer, the third of car trips that are 2km or less make up about 5% of London’s traffic. TfL say of the 35% of total TRIPS that are 2km or less, some could not be removed but say 22% could be actively travelled by people who choose not to, so about 60% could be removed. So that’s about 3% of total traffic if you removed all those available for removal. If you do this by education, persuasion or shaming this would be a significant reduction in pollution and Greenhouse Gas. If you do it by closing large areas of the road network you are pushing the remaining 97% of traffic into congestion on a smaller road network. That’s with 100% removal of available short journey traffic. Most LTN professionals would be over the moon with a 30% modal shift (a 1% removal leaving 99% of traffic to fight it out on the remaining roads).
Bear in mind also you are only removing cars, but the diversion and longer journeys of the remaining cars are causing delays to buses and considerable increased pollution when delaying HGVs and non EV buses.
You can also work out an estimation of the average length of long car journeys using other data and if you do it comes out at 19km. I’ve stuck to the confirmed TfL 17km figure here but the difference is probably due to the fact that the TfL figure comes from a survey of London residents. The 19km figure comes from starting with the total figure for annual mileage in London which would include cars commuting in from outside London, who are generally likely to be on longer journeys. The latter is probably a truer figure since these commuters living outside London are obviously adding to total London traffic.
What this 17km figure also shows is that this top third of car trips make up well over 80% of car traffic. None of these trips are realistically available for walking, and few for cycling so the only real alternative to get these cars off the road is public transport. This would require huge investment to create more infrastructure, more routes, more frequency, more comfort and more affordability and, given the Mayors announcement this week, that aint gonna happen. So instead of addressing the real cause of excess traffic in London all the politicians will take the cheaper option of show politics to look like they are doing something. The only cheap answer is education.
Finally Adrian you haven’t answered my question in #6236 as to why you, or other administrators on the BSfE site have blocked my attempts to debate these issues openly and fairly with the main instigators and architects of these local LTNs. People would be free to believe or not believe these statistics and arguments. They would be free to question them and maybe supply conflicting data or models. Karl could point out why its more complicated than I’m making out but people would at least have the opportunity to make up their own minds. I feel there is damage done to our community that wont be reversed for a long time, if ever, whatever the outcome of the trial, but at least we could reach out and have open debate.
Please Log in or Create an account to join the conversation.
New chance to comment on Fox Lane LTN
Adrian Day
21 Nov 2021 11:40 #6247
- Adrian Day
-
Share
![]()
![]() Share by email
Share by email
Please Log in or Create an account to join the conversation.
New chance to comment on Fox Lane LTN
Karl Brown
22 Nov 2021 10:17 #6248
- Karl Brown
-
Share
![]()
![]() Share by email
Share by email
Then moving on from where you are headed, and I guess would conclude, would be the environmental benefits of opening up roads to make vehicle journeys shorter and faster, including therefore the many thousands of existing LTN’s, including those very local such as Broomfield Avenue. And then the argument would go for even more and ever wider roads, with racier junctions for ever more cars to go easier to maintain that environmental benefit, and so it continues to expand. We’ve been down that route in the UK – maybe LA is still building – and it was stopped because it didn’t work. Now the plan is not to have cars dominating all thinking and doing.
Change is not going to be instantaneous; we may well see road charging as part of the evolving mix and certainly what I would like to see is the environmental free ride given to vehicles where it is residents who currently pick up the tab being reversed: a lot of years since the University of Dresden calculated total external costs of a vehicle at something like £1600pa . That was before the impact of air pollution was known and with inflation since we will doubtless now be well into the £2000’s pa per vehicle. The Cabinet Office produced some simpler numbers at the same time but which were of an equivalent ball park. Load that onto vehicles and see what happens; noting it’s not traffic management that is the root cause of all the pollution problems we face. “Clean air” is one of the ten indicators being used to determine healthy streets, so there are a lot of other dimensions too.
Please Log in or Create an account to join the conversation.