Share this article share on facebook share on twitter

fox lane quieter neighbourhood mapThis map shows the Fox Lane LTN as initially designed. The physical filter at the Fox Lane end of Conway Road has since been replaced by a camera-controlled filter

Following further collection of traffic data during September, after the return to school, Enfield Council is inviting further objections and representations about the low-traffic neighbourhood scheme in the Fox Lane Quieter Neighbourhood. The deadline for submitting comments (by post or email) is 11th January 2022. See below for the text of an update on the Let's Talk Enfield website.

Fox Lane Area Quieter Neighbourhood: Update 5 November 2021

The Fox Lane Area Quieter Neighbourhood was implemented as a trial under an Experimental Traffic Orders (ETO) and the project has been under review since implementation. Restrictions on travel due to Covid-19 were lifted fully in July 2021 and with schools returning in early September, a further set of traffic data was collected towards the end of that month to help assess the impacts of this trial. The Council is now reviewing this data with the intention of publishing a report in the next few months.

If you would like to do so, objections and representations to the ETO can continue to be made. All responses will be considered alongside objections and representations previously made. Please make your objection or representation in writing stating the grounds on which it is being made and quoting the reference TG52/1451. You can send this via one of the following means:

Objections received via email to will also continue to be considered. Objections must be received by 11.59pm on Tuesday 11 January 2022. Please note that any letter or email you write to the Council in response to the ETO may, upon written request, be made available to the press or to the public.

Whilst the Council will not be providing individual responses to any further comments, these will be responded to in the published report, along with the rest of feedback that has already been received.

The monitoring plan for the project, along with a range of additional information, remains available on the dedicated project page: https://letstalk.enfield.gov.uk/FoxLaneQN.

(Source: https://letstalk.enfield.gov.uk/FoxLaneQN)

Log in to comment
PGC Webmaster posted a reply
10 Nov 2021 23:28
See also this report in the Enfield Dispatch

Fresh row over LTN as consultation reopened
Ann Jones posted a reply
11 Nov 2021 08:17
For those who oppose the inequalities of this LTN there is an opportunity to gather and march on Saturday 20 November 2021 at Broomfield Park at 10.00 am. I will try to upload the poster about the march here or please visit OneCommunity website at stopfoxlaneltn.org/
Karl Brown posted a reply
12 Nov 2021 14:57
Will there be food on the march? If not it would be an excellent opportunity to support the often neglected but extensive range of eateries between the post office and Yasir Halim, eg Bengal Bertie’s.
Peter Payne posted a reply
13 Nov 2021 12:19
A quick reminder that if you care about the environment you should join the march advertised above, to remove the LTNs.

TfL say 35% of car trips are 2km or less. I think we all agree that a certain number of these are necessary or unavoidable. TfL say if you take out the necessary ones (people who genuinely cannot walk or cycle 2km, and remember these people don’t necessarily have to own a car, they may be dependent on friends or family to drive them to appointments, or even just out of the house to the park or for a coffee) TfL say that 22% could be done by normally healthy people. They never take into account weather or terrain but let’s ignore that for now. If we agree that for every 100 car trips 22 could be removed let’s see what happens when we remove 20 of them. That’s 90% of them.

TfL figures show that a 2km car trip in an Outer London borough is about 4 minutes driving, and we’ll also assume all these trips are the full 2km. So for every 100 car trips you have removed (20 x 4) or 80 minutes of car time from the roads, and all the pollution and Greenhouse Gases associated with that. But you had 100 car trips to start with, so you are left with 80. If you delay these 80 cars for JUST ONE MINUTE you have put back the 80 minutes of pollution you removed. Any delay beyond this results in INCREASED NET POLLUTION. This is with 90% removal of the short trips available for active travel. Most pro LTN academics would be cock-a-hoop with a 30% removal which means you only have to delay the remaining traffic for more than 20 seconds before you go into net pollution.

This basic logic says that if you persuade, educate or shame people into not driving short trips you will improve the environment and have the benefit of healthier people. If you close large areas of roads to through traffic you will only increase pollution and greenhouse gases because you cannot take enough car time off the road to compensate for the extra congestion you are causing.

LTNs are NOT environmentally friendly. Show you care about the environment by joining the march.
Adrian Day posted a reply
16 Nov 2021 09:46
Yet more evidence that LTNs don't increase pollution. If you want fewer cars on the road, a safer, quieter environment and more people walking and cycling think twice before joining the high traffic neighbourhood supporters. betterstreets.co.uk/monitoring-air-quality-around-the-bowes-low-traffic-neighbourhoods-part-2/#more-3408
Peter Payne posted a reply
19 Nov 2021 01:33
Hi Adrian.
Thanks for the link to your pollution monitoring article. As the article points out there huge imbalances caused by seasonal variations, which tend to be predictable but there are also huge variations caused by other climatic conditions such as air pressure and winds but most importantly, the direction from which our air blocks are coming from. Weather patterns that draw air from the west, ie from the Atlantic tend to deliver relatively clean air whereas weather patterns drawing air from the east tend to arrive already well polluted from industrial and traffic activity from Europe. This can easily mask any local effects due to increased traffic activity for example. One example of this is that prior to lockdown, PM2.5 levels in the months Jan and Feb were well below the previous 3 year average, when lockdown came in March 2020, traffic levels dropped by 70% so you would expect a huge fall off in pollution yet the PM2.5 levels went UP close to the previous 3 year average and only falling back in May.

www.gov.uk/government/statistics/air-quality-statistics/concentrations-of-particulate-matter-pm10-and-pm25#average-hours-spent-in-moderate-or-higher-pm-pollution . Figure 14

So how can we see if there is any effect from a local change such as the introduction of an LTN when big climactic changes may override these ? Well the best way is to look at other close proximity sites which would be subject to the same variables in climate direction, temperature, wind etc. and you also don’t have to consider other variables such as the constant reduction in NOx and particulates occurring due to engine improvements.

In the 14 month periods either side of the Bowes LTN going in, your author on the BSfE site shows there was a decrease between the pre LTN and post LTN averages of 10% in NO2 emissions. So how does that compare to the two other closest Enfield sites, Bush Hill Park and Derby Road ? Over the same 28 month period Bush Hill Parks averages were (pre 18.51 and post 16.04) so a drop of 13.3% and Derby road (pre 30.64 and post 26.34) a drop of 14%. Since all the other conditions between the three sites would be expected to affect them similarly, why did the Bowes park area perform 33% worse than BHP and 40% worse than Derby Road ? The only real variable was the proximity of the LTN.

All this said, the North Circular road site is probably not as affected by the LTN compared to the other perimeter roads and beyond. Any pollution monitoring or modelling that has been done will have scant value since there is no reliable base data to compare it to, either in actual pollution measurements or base traffic counts. It’ll be like trying to do a 1000 piece jigsaw when all you’ve got is the four corners and a bit of blue sky. Nobody will be able to see the true picture.

I have tried to have a debate on BSfE with either you or the architects of these LTNs, (Oliver B, Sarah R, Ian B etc.) about all these statistics but my submissions have not got past the administrators, of which you are one. Why wont you have a reasoned statistical debate that your members can all respond to ? I do thank Basil for this site since at least some reasoning can be done here without simply being shut down.
But going back to my post above #6213, you still haven’t commented on or questioned the figures or logic.

How do you expect to reduce pollution and greenhouse gases with LTNs ? You simply cannot remove enough short journey traffic to active travel to compensate for the extra pollution and GHG you create through longer journeys and congestion. I am in favour of promoting active travel and removing these journeys by education, persuasion and making it safer for walking and cycling, but not where this increases pollution and GHG, as LTNs do, as I consider myself environmentally friendly and why I will be on the march this Saturday. I urge anyone else who considers the fate of the planet is in danger to join us.

Finally, since you have long been involved in the LTNs and the modal shift away from short car journeys, can you tell me what proportion of total traffic do the 2km or less trips make up ?
Karl Brown posted a reply
19 Nov 2021 09:23
I’m delighted that our deadly air quality levels and several associated pollutants now have such awareness and concern. That, when only seven or so years back, after several sessions with leading researchers in town understanding the then silent problem, posts here and letters to the local press to raise awareness were met with a spectrum from disbelief to disdain. Our world has certainly moved far in a short period of time. However I doubt if marching for the right to drive anywhere to save the planet will cut it with any thoughtful observer, even were it not the week after COP26 with the highlighting of carbon associated catastrophes and need for fundamental lifestyle change.
Adrian Day posted a reply
19 Nov 2021 09:58
We've had plenty of debates but your argument is always the same ' I need more data or different data' - and its data you know doesnt exist. No one has time to go down endless rabbit holes, I'm afraid
Peter Payne posted a reply
20 Nov 2021 02:49
Adrian . You dont understand.
I dont need more data nor have I ever said I need more data. I know the answer because I bothered to find out to see what the effects the LTN would have on pollution and greenhouse gases. You are the ones driving this scheme, pretending its good for the environment, and you haven't bothered to find out, yet its critical as to how much traffic you would have to remove to active travel to compensate for the extra pollution you are creating.
Maybe Karl knows the answer, but his comment "However I doubt if marching for the right to drive anywhere to save the planet will cut it with any thoughtful observer, even were it not the week after COP26 with the highlighting of carbon associated catastrophes and need for fundamental lifestyle change." suggests he hasn't bothered to find out either. The point is Karl, any "thoughtful observer" would check statistically whether the methods used to remove traffic are likely to work for or against carbon associated catastrophes.
You also have not commented on the maths or logic in #6213 explaining why the congestion hasn't disappeared as you were led to believe it would.
Karl Brown posted a reply
20 Nov 2021 09:00
Ok, so the primary problem with a one dimensional, one metric look at a complex dynamic system is that it’s a one dimensional, one metric look at a complex dynamic system. Reaching the answer you claim – a sort of Douglas Adams’ 47 – will need q lot more analysis. Let’s consider some of the first levels needed to have any chance of supppoing your claim:-
You seem to have bucketed all pollutants as one. You should separate the key ones: NOx’s, PM’s , CO2 and noise. Each has, often very, different causes, impacts and distributions. You will need to consider interior LTN, boundary LTN and non LTN aspects for impacts. For this latter analysis population locations and their densities will be a necessary factor. Duration will be key because things change and it’s unlikely a single choice of duration will be enough for a sensible conclusion. Then once you are into duration the issue of human behavioural factors and specifically behavioural change will need to be assessed. That in turn will be impacted over time by separate changes, eg Haringey’s proposed LTNs, less trains, better bus lanes. And as we delve deeper into a complex dynamic system there will be more. But just a few examples of impact in the above vein:
Take one street, my own, and the last 2 months alone three cars have been given up. That’s 100% car travel impact.
Take a resident form the next street along and A406 congestion (some might say Bowes LTN causal) was so bad that a weekly trip to Leyton is now undertaken by public transport (2 trains). There will be X% equivalent >2km journeys of such form, and I imagine not only for residents intra the LTN.
Noise is either engine or tyre or both, with a switch to which is the most pronounced over at speeds differing by vehicle. How does that play for a car barrelling down Amberley vs one moving slowly on High Street. What distribution of (harmful) impact to what level of population?
PMs are primarily brake and tyre wear and so similarly, what impact on those of slowing cars on boundary roads vs ones barrelling down eg Amberley?
How does auto engine switch off when stationary and the need for drivers to switch off when an auto facility is not available play out on boundary road pollution. Does it vary by junction and / or time of day?
Does the less but bigger junctions of the boundary have a different pollution profile to the more but smaller junctions of intra lTN journeys? How does that differ for each
Outside of the LTN on the boundary Southgate 5 ways is a highlighted issue. Three streets are LTN independent: has incoming traffic dropped, why if so? What about their outgoing traffic.
Are any of the conclusion different for drivers in vehicle vs the considerable numbers non drivers?
And so on.
It’s probably worth pointing out that it’s not Adrian Day introducing LTN’s rather its government policy (and money), supported by the London Mayor and his Transport Strategy and ultimately Ensiled Council in this case – and numerous councils similarly across the country. It’s a big, complex, changing world.
Adrian Day posted a reply
20 Nov 2021 12:50
So, Peter Payne if this isnt a request for 'more data' what is it? "Finally, since you have long been involved in the LTNs and the modal shift away from short car journeys, can you tell me what proportion of total traffic do the 2km or less trips make up ?".
Adrian Day posted a reply
20 Nov 2021 15:46
People protesting against traffic gridlock on boundary roads around a low traffic neighbourhood walk the boundary roads mid-morning on a Saturday and find there is no traffic on the boundary roads to protest about.


]
Peter Payne posted a reply
21 Nov 2021 03:03
Adrian. This was not a request for more data from you it was a question to see if you knew the answer, ie whether anyone promoting the LTN had tried to find out/ work out what the effects of the LTN would have on the environment. Whether the amount of traffic persuaded off the road by the scheme will compensate for the extra pollution and greenhouse gas you are creating as a result of putting the remaining traffic on a smaller road network, creating congestion ( which according to Rachel Aldreds “LTNs For All” is the necessary “stick” to persuade people not to drive) and causing the remaining traffic to make longer journeys both in time and distance. Would there be a net gain or loss. Ultimately this would determine whether the “trial” was a success or not, at least with respect to pollution and Greenhouse Gases.

Karl, yes the statistics I have given here are a simplified metric of a complex dynamic system, this is a general forum after all and not everyone would be able to comprehend the multitude of variables that would be required to give absolute answers. I have, for simplification, “bucketed all pollutants as one”. But it’s clear that if a car does a 5km journey that takes ten minutes and the next day does the same journey but it takes twenty minutes that the second journey would produce more of ALL the pollutants. Not necessarily twice as much and yes it will vary according to the pollutant, whether you have automatic cut out when stopped, engine temperate and speed etc. so working out exactly for each pollutant is complicated, but it will ALWAYS be more. So although I am not claiming an all encompassing answer (a Douglas Adams 47 you said, I think you mean 42) I am claiming all these dynamics relating to exhaust emissions can be reasonably reduced to be proportional to time on the road with engine running. Brake and tyre wear would be more directly proportional to journey length, speed and amount of braking, but since traffic that has been diverted around an LTN rather than taking the more direct (ie shorter and more environmentally friendly route) one would expect an increase here too, though probably not as great and may be met if there was sufficient evaporating traffic. The problem is, what is sufficient evaporating traffic. In the example I gave in #6312 I removed 90% of 2km traffic and showed how it was impossible to remove this by road closure and not increase net pollution. Your point being taken maybe I should refer to this as net exhaust pollution, but I think you and everyone else knew what I was referring to.

The one dynamic you did not refer to was the build up of exhaust pollution in non or slow moving traffic. As you know moving traffic disperses the gaseous and particulate pollution as it distributes it initially over a wider area and the following cars produce moving air which disperses the pollution. Idling and slow moving traffic allows the pollutants to build up way above the background dispersed levels, even into the three figure ug/m3 levels which are far more dangerous to people with respiratory conditions. This is exactly what the LTNs are doing.

I will return to your other points at a later date or else this will turn into a essay rather than an post, suffice to say here the figures are looking at the overall net effects and clearly they will differ inside LTN, on boundary roads and further affected roads, and there will be areas unaffected by local traffic changes, though all areas will be ultimately affected by the Greenhouse Gas issues. The benefits will largely be obtained inside the LTN and the detrimental effects outside.

But now to return to Adrian’s rebounded request, what’s proportion of traffic is made up by cars doing 2km or less journeys. We know this target group for active travel constitutes 35% of car trips. In fact the three grades of trip lengths fall quite nicely, if approximately into thirds. The often produced TfL pie chart (attached) shows that roughly another third of car trips fall into the group of 2-5km and the top third of car trips, over 5km. Because TfL produce a breakdown per km grouping we can see the short journeys average approximately 1.6km, the medium length journeys about 3.4km, but TfL give no breakdown of journey lengths above 5km so what is the average here ? They just say this third of traffic is doing trips longer than 5km. Now we can work it out, which I did, but wanted to confirm this with TfL, which they eventually did. Their London Travel Demand Survey 2020 showed the average for the group of cars doing above 5km is 17km, I repeat that’s the AVERAGE.

I asked for a link for where this is published and they couldn’t supply one because they haven’t published this fact (I wonder why?) they just gave me the table from the survey breaking down this group and said they couldn’t direct me to the actual survey data due to “data protection rules”.
So a car on a long journey (ave 17km) is on the road over 10.5 times longer than a car on a short journey (ave 1.6km) so constitutes over ten and a half times more of the car traffic. The medium journeys take over twice as long as the short ones so for every 13.5 cars on the road at any one time only one is on a short car trip. That’s a bit over 7%.

But this is only short journey cars as a proportion of cars, not of total traffic. Add in the HGV’s , LGV’s, buses and taxis etc. and you find cars nowadays make up around around 75% of total traffic (used to be around 80% but there been a substaintial increase in LGVs due to supermarket and internet deliveries) this 7% figureas a proportion of cars reduces to around 5% as a proportion of total traffic.
So here’s our answer, the third of car trips that are 2km or less make up about 5% of London’s traffic. TfL say of the 35% of total TRIPS that are 2km or less, some could not be removed but say 22% could be actively travelled by people who choose not to, so about 60% could be removed. So that’s about 3% of total traffic if you removed all those available for removal. If you do this by education, persuasion or shaming this would be a significant reduction in pollution and Greenhouse Gas. If you do it by closing large areas of the road network you are pushing the remaining 97% of traffic into congestion on a smaller road network. That’s with 100% removal of available short journey traffic. Most LTN professionals would be over the moon with a 30% modal shift (a 1% removal leaving 99% of traffic to fight it out on the remaining roads).

Bear in mind also you are only removing cars, but the diversion and longer journeys of the remaining cars are causing delays to buses and considerable increased pollution when delaying HGVs and non EV buses.

You can also work out an estimation of the average length of long car journeys using other data and if you do it comes out at 19km. I’ve stuck to the confirmed TfL 17km figure here but the difference is probably due to the fact that the TfL figure comes from a survey of London residents. The 19km figure comes from starting with the total figure for annual mileage in London which would include cars commuting in from outside London, who are generally likely to be on longer journeys. The latter is probably a truer figure since these commuters living outside London are obviously adding to total London traffic.

What this 17km figure also shows is that this top third of car trips make up well over 80% of car traffic. None of these trips are realistically available for walking, and few for cycling so the only real alternative to get these cars off the road is public transport. This would require huge investment to create more infrastructure, more routes, more frequency, more comfort and more affordability and, given the Mayors announcement this week, that aint gonna happen. So instead of addressing the real cause of excess traffic in London all the politicians will take the cheaper option of show politics to look like they are doing something. The only cheap answer is education.

Finally Adrian you haven’t answered my question in #6236 as to why you, or other administrators on the BSfE site have blocked my attempts to debate these issues openly and fairly with the main instigators and architects of these local LTNs. People would be free to believe or not believe these statistics and arguments. They would be free to question them and maybe supply conflicting data or models. Karl could point out why its more complicated than I’m making out but people would at least have the opportunity to make up their own minds. I feel there is damage done to our community that wont be reversed for a long time, if ever, whatever the outcome of the trial, but at least we could reach out and have open debate.
Adrian Day posted a reply
21 Nov 2021 11:40
The BSfE facebook group is a community space for people who broadly agree with our five asks - we engage and debate with others at meetings, on other social media sites and platforms (such as this one) and in person every day. We are entirely voluntary and the handful of people who do most of the communication have jobs, families and social lives so simply dont have the bandwidth or time to engage in every debate and every question asked. I would add that people on the BSfE facebook page are not the policy makers, designers or implementers of low traffic neighbourhoods - we are supporters of active travel including ending high traffic neighbourhoods. From what we have read, seen and experienced we are confident that ending through traffic from unclassified roads is a good idea.
Karl Brown posted a reply
22 Nov 2021 10:17
Without wanting to spend time on ever more maths logically if you send a polluting machine from A to C to get to B rather than going AB direct where that is shorter and / or faster than ACB then in a steady state the chances are that polluting machine will generate more pollution than before. The direction you seem to be heading is to generate ever more complex assumptions to create a broad local break-even, here and now, conclusion for such a scenario. Good luck, I would find it more interesting than crosswords but not something that will grab me.
Then moving on from where you are headed, and I guess would conclude, would be the environmental benefits of opening up roads to make vehicle journeys shorter and faster, including therefore the many thousands of existing LTN’s, including those very local such as Broomfield Avenue. And then the argument would go for even more and ever wider roads, with racier junctions for ever more cars to go easier to maintain that environmental benefit, and so it continues to expand. We’ve been down that route in the UK – maybe LA is still building – and it was stopped because it didn’t work. Now the plan is not to have cars dominating all thinking and doing.
Change is not going to be instantaneous; we may well see road charging as part of the evolving mix and certainly what I would like to see is the environmental free ride given to vehicles where it is residents who currently pick up the tab being reversed: a lot of years since the University of Dresden calculated total external costs of a vehicle at something like £1600pa . That was before the impact of air pollution was known and with inflation since we will doubtless now be well into the £2000’s pa per vehicle. The Cabinet Office produced some simpler numbers at the same time but which were of an equivalent ball park. Load that onto vehicles and see what happens; noting it’s not traffic management that is the root cause of all the pollution problems we face. “Clean air” is one of the ten indicators being used to determine healthy streets, so there are a lot of other dimensions too.
Tony Maddox posted a reply
22 Nov 2021 13:24
Models – predicting, on first principles, the local atmospheric levels of gaseous and particulate emissions resulting from car exhausts under different circumstances as Peter Payne has tried to do, is difficult and will, as Karl Brown says, be subject to multiple variables in the real world, analogous to the highly complex, computer-based climate models for which the “heat dome” over the North West Pacific this summer was an anomaly. That’s why there is an ongoing interplay between the models and the experimental data. The LTN is a trial and there will be some data next year. I’m sure Peter Payne is sincere in his concerns about air quality but I worry that his arguments will be used by others for whom concerns about “the environment” are theoretical at best.
Essential journeys – there is not a binary distinction between essential and non-essential car journeys. An example of the latter might be driving a quarter of a mile to buy a pint of milk while the former would include a modified car taking a person in a wheelchair to an outpatient appointment. However, there is a spectrum between these without a sharp boundary and almost all of these journeys involve a choice. It may not feel like it in the sense that the choices have been internalised as reflexes but they are choices nonetheless. I think most would agree that an able-bodied person using a car instead of a 10 minute round-trip walk is not sensible but I accept that the closer one gets to the “essential” end, the more involved might be the choices’ outcomes and that they may not be easy but difficult is not the same as impossible.
Cycles – no, not that kind. When politicians talk about sorting things out for “decades to come” or “for a generation”, whatever their sincerity, they have an eye on the current election cycle and how the phrase will be received by the current voters - there is always a short-term element. However, we all tend to default to short-term effects. The inconvenience and irritation of a thwarted or altered drive occurs in the present and fills our thoughts while the benefits of drives not taken, both to ourselves and to other people, accrue incrementally into the future, in terms of the moderate exercise and health benefits and freeing up a space on the road for those who do actually need it.
Disasters – the LTN has twice been described as a “disaster” in these pages. This is not a disaster. Even if you don’t like it, it’s at worst an inconvenience. The floods in Canada now or in Germany in July as well as the fires in California and Australia earlier this year and last year are disasters.
Cities – there has been a view expressed that we live in a city and thus shouldn’t expect rural levels of atmospheric pollutants etc. Obviously, it would be unreasonable to expect the air quality in Palmers Green to be that of the Cairngorms. However, I’ve no doubt that, before Bazalgette, there were people who were of the view that being ankle deep in human waste and having open sewers for rivers was to be expected in a metropolis and that digging up the roads to put tunnels under them was an intolerable inconvenience. Obviously, this major infrastructure involved public money, as did the phasing out of coal-fired heating after the great smog of 1952 and at the end of over 130 years of smoke abatement campaigns ( www.historyandpolicy.org/policy-papers/papers/clearing-the-air-can-the-1956-clean-air-act-inform-new-legislation ) and as will the phasing out of gas boilers. A closer analogy is perhaps the change in behaviour involved in the use of tobacco products, particularly in public places, which has involved data, exhortation, shock tactics, nudge legislation and so on. There is also a parallel in the techniques of the industries with a financial interest in the ongoing use of these products. The basic point is that a majority accepts, however grudgingly, high levels of some pollutants until a tipping point is reached. There would not now be even moderate support for a return to smoking on public transport or in restaurants.
And finally - it is easy, when the news talks about millions of tonnes of CO2 and shows pictures of factory chimneys belching steam, to assume that no change is worthwhile before major governmental and industrial change (which clearly are crucial), so here’s another back-of-an-envelope calculation. A litre of petrol produces about 2.3kg of CO2. A car with a fuel efficiency of 40mpg which does about 10,000 miles a year therefore produces about 240kg of CO2 a month. In other words, at this mileage, each month, an average family car produces a weight of CO2 equal to the average family (roughly 2 adults and two youngish kids) or, in 6 months, its own weight in CO2.
Whatever one thinks of LTNs, there is no solution to the current climate problem that does not involve fewer car-based miles (or engine revolutions). This also includes electric cars (though clearly a better option now) at least until electricity is genuinely 100% renewable. That’s before you get to traffic volume, for which the status quo before 2020 was a straight line with a positive gradient ie increasing and not static. LTNs may be a blunt instrument but, to paraphrase the Prime Minister, “if not this, then what?”
John Machin posted a reply
22 Nov 2021 17:36
Karl Brown, I wasn't marching for 'the right to drive anywhere', and neither was anyone I spoke to there. I was marching to raise awareness of the bad science that is LTN theory. Why do LTN supporters like yourself constantly have to resort to imputing bad faith in opponents when making their points? I don't try to misrepresent supporters' arguments; please don't misrepresent ours.
Adrian Day posted a reply
22 Nov 2021 17:42
What is that 'bad science'?
Karl Brown posted a reply
22 Nov 2021 17:59
John Machin - unless you’re also Peter Payne, where there has been a series of quite meaty knockabout, I didn’t. Always best not take things out of context as it can cause unnecessary problem. Please, give examples of my inputting bad faith in opponents and do note that I’d rather not be classed along with LTN supporters like myself, whatever that means, I have my own views and make my own case. By all means take up the bad science and LTN theory issue you say you have issue with; HMG, Department of Transport and GLA / TfL seem to support it. Doubtless they’ll listen to a solid case as traffic is a complex area.
John Machin posted a reply
23 Nov 2021 02:52
It's good that the debate seems now to be moving onto more of an evidence-based basis. BS4E's analysis aims to correct for the effects of the lockdown (as far as possible) and for seasonal effects - both of which make sense.

Unfortunately, they come up with a spurious conclusion, i.e. that the LTN has achieved a 28 percent reduction in NO2. Their data does not support that.

If you observe a change in a local quantity (a reduction in pollution) and you wish to attribute that effect to a local cause (the presence of an LTN), you must compare your numbers to those from other places where that cause doesn't exist. If you observe similar reductions in pollution in those other places, then you can't claim that it was the LTN that caused the local pollution reduction. BS4E's analysis doesn't do this comparison, so I have.

I looked at two other roadside pollution monitors on or near the A406 in NE London, using exactly the same methodology as the BS4E study - comparing monthly mean (average) NO2 figures for two 14-month periods, i.e. Sept 2018 to Oct 2019 and Sept 2020 to Oct 2021.


As the graph shows, the Bowes LTN figures (bold red lines) sit fairly comfortably within the figures from the other 3 sites. The important measurement is the reduction in NO2 between the 2018-19 period and the 2020-21 period. I've not applied the small reduction that the BS4E study made to allow for the effect of less polluting vehicles over time, because I wasn't convinced by the methodology for calculating it, but it would only make about 2 percent difference to all the figures. So the raw reduction figure for Bowes is 31 percent.

What you see is that the reduction in NO2 observable in the Bowes numbers is matched by reductions at the other two sites, which suggests BS4E cannot use those numbers to claim that the LTN caused the reduction. Put simply, very similar NO2 reductions occurred elsewhere without the presence of an LTN.

Here are the NO2 reduction percentages in case you can't see the graph and table properly:

Enfield – Derby Road: 33.6 % with no adjacent LTN
Enfield - Bowes Primary: 31.0 % with an adjacent LTN
Redbridge – Gardner Close: 29.9 % with no adjacent LTN

The roughly 30 percent reductions are a good news story in themselves, of course, and need explaining. But the Bowes reduction cannot, on BS4E's evidence, be attributed to the LTN.
John Machin posted a reply
23 Nov 2021 03:17
Well, here's what you said in post #6237 :

19 Nov 2021 09:23 #6237
Karl Brown
I’m delighted that our deadly air quality levels and several associated pollutants now have such awareness and concern. That, when only seven or so years back, after several sessions with leading researchers in town understanding the then silent problem, posts here and letters to the local press to raise awareness were met with a spectrum from disbelief to disdain. Our world has certainly moved far in a short period of time. However I doubt if marching for the right to drive anywhere to save the planet will cut it with any thoughtful observer, even were it not the week after COP26 with the highlighting of carbon associated catastrophes and need for fundamental lifestyle change.


There'd been discussion of the local march earlier on in the thread, so how was I getting you out of context? What is 'marching for the right to drive anywhere' if not an imputation that the marchers are selfish? Do please explain what you really meant, though I don't see what other interpretation anyone could put on your words, in the context of a debate over LTNs.
Karl Brown posted a reply
23 Nov 2021 09:02
John Machin, very much Peter Payne focused and very much linked directly a long exchange we have been having. If you choose to take a debate between two out of its framework and into some general all-person sphere than I can only suggest not to. PP was specific in why he was marching. If, and then why specifically you – and others - marched I have no idea and nor would assume.
PP has long been undertaking extremely detailed pollution based analysis. He clearly, and rightly in my view, has a real concern of its impacts and is then developing an argument against LTN’s based on same. He believes his numbers, sees them as proving a powerful adverse environmental result of the Fox Lane LTN and said he was marching on that basis. My counter view, as expressed, is that such is the huge range of variables and inherent complexity that there can be no effective definitive answer; there will always be an alternate boundary line capable of being drawn, future uncertainty vs past data, and much more. 47 rather than 42 as some might think of it. So while not perfect, the simple traffic data count I believe is to be used in the final report should be adequate for what is needed. I‘d expect we will see a better position for some streets a worse position for some roads, but best wait and see.
A better outcome for pollution based concerns would be if efforts were channelled into extending the ULEZ to the M25 rather than having a single LTN focus – my view.
John Machin posted a reply
23 Nov 2021 18:36
Fair enough, sorry if I butted into a longer discussion but it is all on a public thread.

You believe the issue is all too complex to calculate, but if true that cuts both ways, of course. Councils shouldn't then be spending scarce time & resources on schemes whose outcomes are impossible to measure. In the absence of a reliable method of assessing the impact of what you do, 'first do no harm' would be the guiding moral principle. And if you can't measure harm, logically the only way to be sure of doing no harm is to do nothing.
Karl Brown posted a reply
24 Nov 2021 08:43
Reasonable points and the precautionary principle is inevitably a good yardstick to employ but the traffic picture in London / Enfield / locally is more than air pollution in any or all of its several forms. Personally I would never lead the case for LTNs on air quality. Where I see the government and Mayor is in seeking ways to tackle the issue of congestion before everything grinds to a halt. It’s a dire problem, also causing adverse externalities and forecast to get so much worse that it’s unsustainable. The intro section to the London Transport Strategy 2018, confirmed in 2021, paints a good summary. I think the UK figures go something like 1m+ vehicles in the 60’s, roughly 40m now and one government scenario putting the possible increase at a further 51% by ?DATE? I guess that’s a worst case line but clearly road space hasn’t increased at anything remotely approaching that rate, and barely at all in London and roads also have to absorb much bigger cars (+30% or so in size over the period). Something has to give. There is and long has been any amount of bad congestion not so distant and independent of any LTN impact.
The UK’s top air quality man puts it this way, if AQ is the focus then to travel, walk, else cycle, else use public transport and if none of those is possible and you must drive then do so using the cleanest meant possible, I guess he means electric. I always thought it was perfect guiding principle for the issues we face.
Tony Maddox posted a reply
25 Nov 2021 07:25
My understanding of what Karl Brown was saying was that predicting, on first principles, the outcome of changes in traffic arrangements, particularly on local levels of vehicle emissions, is complex and subject to many variables. There are academic examples on the Web and they are not simple. However, the Council has not tried to do that. It has effected a change and has endeavoured to measure the outcome across a number of parameters, an experimental rather than theoretical approach, if you like. There will be data next year. I'm sure there will be a spirited discussion over its interpretation.
To take one effect of vehicle use, there is no solution to the current climate problem that does not involve less driving. There is likely to be some form of road pricing before the end of decade, both for this reason and because the Treasury is going to have to recover the taxes lost in fuel duty involved in the switch to electric cars.
Sue Beard posted a reply
25 Nov 2021 08:06
Some really interesting posts here but I still don’t understand why the answer to too much and increasing traffic is letting all roads be treated as main roads.
Paul Dick posted a reply
25 Nov 2021 09:27
Hi Peter,

Maybe have a look at this link and remember it's up to you to start making the change:

www.pgweb.uk/forum/road-traffic/1331-if-we-all-choose-the-fastest-mode-of-travel-in-a-city-the-whole-city-gets-slower#6260

Paul.
Peter Payne posted a reply
27 Nov 2021 20:14
As others have joined this thread I’ll try to reply specifically using post numbers.

#6247 Adrian. With respect to BSfE I can say I broadly agree with four of the asks, but my research, much of which you have seen, leads me to believe the LTNs are largely negative with respect to the environmental claims as well as having great regret on how it has divided the community and the real negative effects it is having on many people’s lives. If this were a fair trial one would expect it to be judged fairly whereas we are being told that one person is going to make that decision, he has already made up his mind, he doesn’t enter into debate or discussion, he tweets only information in favour of the LTNs and blocks anyone wishing to give an alternate view. It is reminiscent of Peter Cook’s judge at the Secret Policeman’s Ball.

I do thank you Adrian, Karl and occasionally Basil for at least debating your positions and not blocking the views of others you disagree with, at least on this site. However we are told the main architects of the local LTNs, and apparently many more to come, are all within the BSfE and the likes of Oliver B, Clare R and Ian B himself do not engage on any platform. I fear that the information given to members of BSfE by the administrators is so controlled that, although they may be aware of vast opposition they might be surprised WHY there is vast opposition, since they have not been exposed to factual correct statistical analysis, all from TfL figures, or indeed analysis of evidence such as the Waltham Forest report, The Cairns paper, The WF Kings Report, The WF traffic counts, Rachel Aldreds paper on effects of LTNs on active travel etc., plus the claims that traffic in London has increased by 20% in the last ten years which even TfL do not believe (see next post).
When I have raised all these issues at various times in these forums, not once has anyone actually shown anything to prove me factually wrong except Basil once corrected me on how much was spent on Walthamstow Village which I immediately admitted my error.

In #6247 you claim you are against High Traffic Neighbourhoods and yet you are creating them all around the Low ones because your evidence for traffic evaporation is questionable and shown practically by the trial not to have happened. We were promised by the (flawed) evidence of Cairns and WF that after a time things will settle down. Well it’s been well over a year now and I think people sitting in queueing cars every morning and evening will beg to differ. You also claim “From what we have read, seen and experienced we are confident that ending through traffic from unclassified roads is a good idea.” How can what you are seeing and experiencing be so different from the majority of residents who are so moved by their experience they marched in their hundreds last weekend ? Further, with respect to “unclassified roads” is Brownlow Road an unclassified road ?

Karl you have often complicated things by showing that things are indeed more complicated, but you haven’t actually disproved or factually questioned the data, because you know it’s all from TfL or reputable sources. In #6248 in your ABC example you seem to agree with me that more pollution and GHG are produced by the forcing of traffic around an LTN. I am not however “generating more complex assumptions…” I have shown if you get rid of 90% of the short journey traffic you only need to delay the remainder by one minute to regain all the pollution back. It is an approximate assumption because of complexities in measuring different pollutants but it aint gonna be far out. Your only real argument to this would be to prove traffic isn’t being delayed for more than one minute. For the traffic that was going through the LTN, almost certainly the ACB trip rather than the AB trip will account for this additional time, irrespective of additional congestion. For residents of the LTN 50% of their journeys are likely started going in the wrong direction, irrespective of additional congestion. For traffic that was always on the perimeter (and beyond) roads you would have to show there is no, or very little congestion, for them not to be adding additional minutes on their journeys. But the other figures show this short journey traffic constitutes so little of total traffic that the 97% that is remaining is being concentrated on fewer roads, all being diverted to junctions already close to peak flow at many times of the day, so causing congestion, delays and pollution. In addition, if there are any problems such as roadworks or an accident, there are often no alternatives so even more pollution is produced.

Would I open up old road closures? This would have to be a judgement call on an individual basis. There are obvious cases where individual road closures are necessary. Where a small road offers cars the opportunity to avoid a set of traffic lights for example, and Broomfield Avenue probably falls into this category. Whereas I would open up Connaught Gardens onto the North Circular to relieve the pressure on Callard Avenue and the narrow surrounding roads off Hazelwood Lane. Traffic could join the NCR and use the underpass, relieving traffic on the Cambridge Roundabout itself. Keeping the width restriction at Hedge Lane end to stop large vehicles, Connaught Road is nearly twice the width of other roads in the area. Some individual road closures make sense and I am fully in favour of school street closures at the appropriate times. This is very different to closing 10km of road network to through traffic, as in Fox Lane LTN, particularly when there are further proposals to create more such large areas of LTNs often butting up against one another.
No I am not proposing building new wider faster roads. This is not a genuine extrapolation of what I am saying is an existing problem with the current LTNs.

The additions complexities you bring to light, you say make my broad statistics questionable. You then say, in #6257, “So while not perfect, the simple traffic data count I believe is to be used in the final report should be adequate for what is needed.” So all these complexities will be solved by counting traffic on one random week, many on roads where there is no pre LTN baseline figures for comparison ?

I thank John Machin for further analysis of the pollution claims posted by Adrian from BSfE. I presume the original BSfE post was done by the same person who did a similar analysis some months ago (Hal Haines ?) Yet on his original post he tried to prove something by comparing the Bowes site to other local sites. In this case he doesn’t. Did he forget to do this or did he do this and got the same outcome as both John and myself, and decided not to report this because the pollution readings show a detrimental effect caused by the LTNs ?

I agree with much of what Tony Maddox says in #6249 except the very last lines. That’s before you get to traffic volume, for which the status quo before 2020 was a straight line with a positive gradient ie increasing and not static. LTNs may be a blunt instrument but, to paraphrase the Prime Minister, “if not this, then what?”

Karl also leads the same way in #6259 with regards to ever increasing traffic. Karl admittedly is using figures relating to the whole country but the assertion that car traffic figures IN LONDON are on a constant straight line increase is not what TfL believe has happened. TfL believe that car traffic mileage has not gone up AT ALL in the period 2000- 2019 but has been in slight decline. This is the opposite of what the Dept For Transport show in their files. I’ll cover this further in my next post.

Tony, yes others may jump on these facts for other reasons, be that party political or they don’t want to adjust their lifestyle, but that doesn’t alter the facts. Similarly there will be many who have jumped on the “active travel” selling of the LTNs who simply want a quiet road, an “oasis of calm” in one of the largest commercial cities in the world, and don’t give a monkeys that they are exporting their noise, pollution and stress to their neighbours, and causing further damage in net pollution and GHGases.

Karl, in #6259 you state “Personally I would never lead the case for LTNs on air quality.” But whatever you lead the case on you would surely have to show it is not detrimental to air quality. The rest of this post relates to an ever increasing traffic problem with more and more cars on the road. This is not the case for London as I will show in my next post.

Sue Beard #6263. No one is saying that all roads should be main roads. Traffic through the LTN before it was closed was substantially lower than on main roads but a minority of residents were not happy with their share of the level of traffic and wanted none whatsoever. If this could be achieved without making problems considerably worse for everyone else, including the planet as a whole, then I doubt there would have been a problem.

Paul Dick #6266. I have read the article and there is some truth in it. However, it concentrates on improving things for cyclists, pedestrians and public transport. I am not against any of these, assuming they are designed in such a way they encourage people out of their cars without increasing pollution or GHGases. I have never been against encouraging active travel or cycle lanes, provided they are well designed and not deliberately constructed to slow down the remaining traffic. What the article doesn’t address is closing large areas of roads leading to increased congestion and concentrated, net, increased pollution. Deliberately increasing congestion is regarded by many as a way of persuading people not to use their cars. It is a very blunt instrument with many knock on effects especially when, as I have pointed out many times, if they are used to remove a proportion of short journey traffic whilst delaying the vast majority which has to remain. In case you missed the earlier post, removing ALL available 2km or less traffic leaves 97% of traffic on the road. Well over 80% of traffic is vehicles doing over 5km journeys and they average 17km. The only real alternative among the car drivers of this group, apart from really keen cyclists, is public transport. One role that LTNs play in public transport is to slow down the buses.

The main area I agree with the article is that much could be achieved by education, and there will be a generational change as we are seeing that in some demographics car use is falling considerably. I also agree that for those that have to drive, the faster the move to electric cars the better which is why I feel the amount of money being wasted by councils on LTN schemes, being negative to the environment, could be better spent putting in the required infrastructure for electric and ultimately hydrogen vehicles.
Peter Payne posted a reply
27 Nov 2021 20:21
Has Traffic in London increased by 20% since 2008 and will it carry on increasing ?

This is fundamental to the traffic debate in London yet the Dept for Transport (DfT) disagrees with with Transport for London (TfL) quite dramatically on this. DfT say car traffic in London has risen around 20% in the period 2008 to 2018, and following the trend will continue to rise, whereas TfL say it has fallen slightly over this period and will continue to fall. So why do they differ and who is right ?

The difference arises directly from one survey carried out by DfT over the whole country, known as the Minor Roads Benchmarking Exercise (MRBE). TfL basically say the effects seen do not apply to London and the adjustments caused by this survey don’t agree with their independent figures.

A quick review of how traffic volume is counted is helpful here. Traffic is counted by various means but predominantly on major roads it is automatic 24hr counting, either by strips driven over or by people counting from fixed video cameras at junctions. In addition certain fixed points on the road network, on more minor roads, are counted by people using hand clicking counters and they do this at the same time of year, at the same places for a limited number of days per year. Once they know how much of each category of traffic is travelling over which category of road they multiply the figures up by the total length of that type of road on the whole road network. It is generally agreed the final figures, although they may appear to be very precise, are not that reliable as total kilometres driven, but because they are measured at the same points, either constantly, or at the same time of year, they are very good at showing any changes in the amount of traffic, ie whether it is increasing or decreasing.

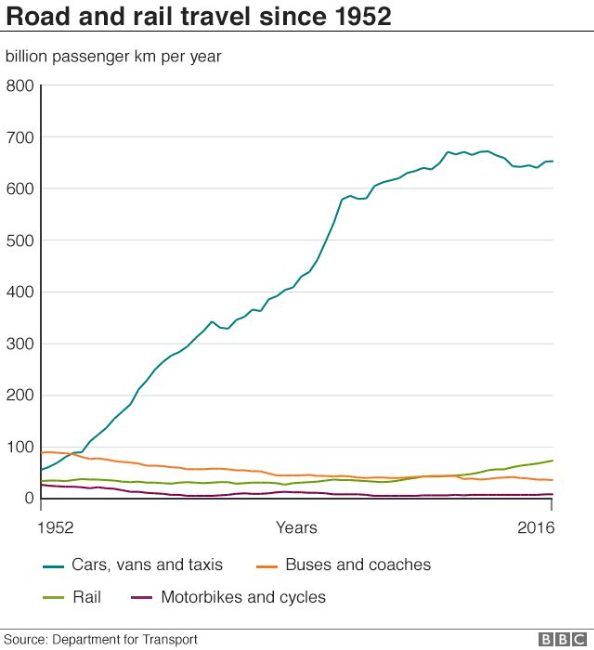
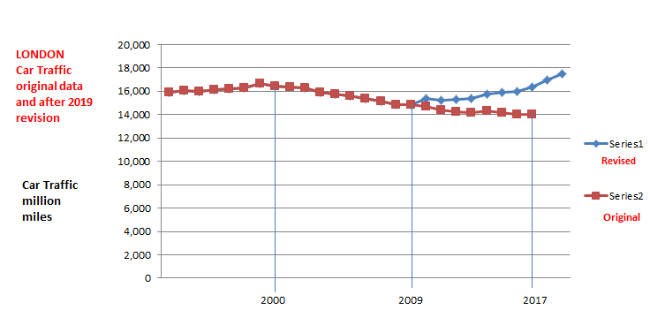
In the graph below the brown line represents the car traffic measured annually in miles by the above methods for London. As you can see from 1999 onwards the car traffic has shown a steady and constant decline to about 2013 and has flatlined since then. Then in 2018 came the Minor Roads Benchmarking Exercise. During this nationwide survey they hand counted traffic on minor roads chosen at random. They divided the roads up into urban and rural traffic and as a result they discovered there appeared to be 20% more traffic on urban minor roads so for London and other urban areas they increased their actual measured figures for 2018 by 20%. As this would look ridiculous to have a flat line graph suddenly jumping up 20% in one year they revisited all the data back to 2008 and increased them proportionally to show the blue line in the graph and these are the figures you can now find in file TRA8902. As they didn’t introduce a new file with the new adjusted figures, they simply changed ten years of data overnight. You cannot now access the old figures. I have them if anyone wants to check.


So how do we know that TfL do not agree with the changes? TfL do their own traffic flow measurements and, in addition, do many more calculations including an annual survey known as the London Travel Demand Survey (LTDS) where they ask thousands of people about their travel methods, distances etc. TfL state in their Travel In London Report 13 (2020) section 3.9 around page 92.

" The result of this exercise includes revisions to the minor road traffic estimates covering 2010 to 2018. The revisions mean that, for 2018, the DfT estimated vehicle kilometres were 20 per cent higher than previously reported last year (and included in Travel in London report 12). The previous estimates suggested a fall of 1.8 per cent in vehicle kilometres in London between 2009 and 2018, whereas the revised series now suggests an increase of 17.9 per cent over the same time period, this suggested change wholly arising from revisions to the minor road estimates. We are currently working through how the DfT have made this assessment, and what this could mean for London datasets. For this report therefore, and pending further investigation of this revision with the DfT, we consider it reasonable to base our assessment of changes between 2018 and 2019 on TfL’s own traffic monitoring data – applied to the historic DfT series – which had previously shown trends broadly in accord with the DfT data.”

This is slightly couched language but the “applied to the historic DfT series” means they are using the old figures, now not available to the public, as the new figures bear little relationship to the figures they are measuring themselves.

On page 93 we have “Trends in the numbers of motor vehicles crossing the three London strategic counting cordons and the Thames screenline provide a third indicator of traffic volumes, and they also show a broadly similar pattern to the other two indicators, prior to the revisions to the DfT series.”
And “Total flows across the three cordons were down by 0.6 per cent between 2009 and 2018 – a broadly similar trend to that shown by TfL data and, prior to the 2019 revisions, by the DfT data.”
And for cars specifically “The overall picture of declining car volumes over recent years has not affected all parts of London in the same way.”

So who is correct for London DfT or TfL ? DfT measurements were broadly in line with TfL until the nationwide MRBE was applied to London. TfL do far more research in London than DfT. But are there other ways we can check ?
If car traffic has gone up 20% in London this could only be achieved by more cars on the road or people driving more trips and/or longer journeys. The DVLA file VEH0204 shows cars registered in London increased by 2.5% between 2008 and 2018, so unless these cars were particularly busy you are looking for an increase of around 17.5% from the existing number of cars.

The London Travel Demand Survey looks at total number of trips taken by car which over this period is consistent at 5.8 million car trips per day, dropping slightly from 6 million a day ten years ago.
TfL also track the time taken for real trips in central, inner and outer London boroughs and this has barely changed over the ten year period.

So taking the above statistics together, if DfT are correct, there has been an increase in car traffic of 20% from an increase in cars of 2.5%, from the same number of trips with no slowing down of traffic overall. This would mean existing traffic would have to drive 17.5% further on average for every trip driven, with no addition congestion to slow things down. If you own two cars each would have had to have been driven 17.5% more on average. This is over a period where fixed road network length has barely changed, CPZ’s were rolled out and tube traffic increased.

Given that TfL are probably very confident they are correct why do they allow people like Rachel Aldred of Westminster University (whose work they fund), many councillors such as Ian Barnes, and numerous lobby groups such as the London Cycling Campaign, Better Streets groups and other professional lobby groups to continually claim there has been increasing car traffic in London? So much so that in Trumpian terms, if you say it often enough this becomes the facts.
Karl Brown posted a reply
28 Nov 2021 16:09
That’s a lot! I will study, not yet but did notice something early about blocking and LTN architects before I realised there were more words and detail than current time permitted. I can’t block anyone on here and other than local press – who can and do ignore letters – that’s me. I also think it’s really important for everyone to realise that it’s HMG / Department of Transport who are pushing LTN’s (and paying for them) and here in London with the full support of Mayor Khan and the GLA / TfL. Cross party stuff, unusually. The local issue is how best to manage traffic in line with the requirements of the London Plan (Transport Strategy) rather than whether LTN’s generally are good or bad things.
Chris Bryant posted a reply
29 Nov 2021 11:42
I just wanted to briefly throw my hat into the ring here. Obviously this is quite a hotly contested debate but I just wanted to fly the flag for those like me who don't live in the LTN, do drive and also support the scheme. I think its a very dubious argument when people say schemes like this only benefit people who live within the LTN. I live on the other side of Green Lanes but think the LTN is great. Yes, there is some minor disruption but the positives are fantastic- I can walk up to Grovelands Park with my child on a much quieter road, cut along to alderman's hill and cycle through the area (which I would never have done before the implementation of the LTN).It makes the area so much more pleasant. I think that there is a sense of jealousy from some people that they don't reside in the area, don't feel the immediate benefits and just see more traffic jams in the surrounding areas. I empathise as I have experienced this but a few minutes on to people's journeys (I think) is a small price to pay for having safer and quieter streets. Clearly this is the (if you pardon the pun) direction of travel in the future. Our streets were never designed and built for motor traffic and if people won't drive less than segregation is the only viable option. I remember the outcry when small city centre's were first pedestrianised (Canterbury/ Norwich etc..) and now people think its crazy that traffic was ever allowed down them. I think large residential neighbourhoods will eventually go the same way. Transition is never easy but if you look around at everything happening in tandem- electric cars/ driverless cars/ the climate crisis it's pretty clear that we're moving to a more sustainable world.
Alan Thomas posted a reply
30 Nov 2021 09:06
Chris Bryant wrote:

Our streets were never designed and built for motor traffic...


Fox Lane, Green Lanes and Aldermans Hill may have originally been bucolic (and muddy) country lanes, but I would contend that most of the streets within the Fox Lane LTN *were* designed and built to accommodate motor traffic.

Indeed the streets, houses and the utilities below them were actually constructed by workers who used motor lorries and the homes were expected to be serviced by trades which were in the process of moving from horse-drawn to motorised vehicles - including battery-powered electric delivery trucks.

Growing up the area during the 1960s, the only horse-drawn service vehicle to be seen on our street was the Rag And Bone man. By then already an anachronism, even if we kids thought his horse was lovely.
Karl Brown posted a reply
01 Dec 2021 15:18
Peter, you have presented much detailed work and clearly have invested much time and thought. That must be acknowledged. I have previously given a view on your snapshot based on its chosen assumptions of (what will be generic) LTN pollution impacts and then the logical implications of your conclusion. I’m not familiar with the many reports you mention and don’t plan to dig them out and read but instead I’ll raise two themes: firstly that your direction indicates satisfaction with the present level of traffic. To the contrary I would say that traffic related congestion is and has been endemic for years. There are basically too many cars / miles driven for the supporting infrastructure (include parking) and controlling that is London’s agreed target. If the DoT/TfL conflict you outline does reveal a slow decline of late then perhaps the actions of the past few years are on track. The second is what looks like an acceptance that whatever the levels of traffic on residential streets then it’s fine, provided it’s better for the driver. Again London’s clear intent doesn’t support you in this.
For about a decade there were very regular and repeated exchanges in the local papers (Musey / Hughes) which essentially boiled down to one believing that all traffic constraints should be removed to offer maximum utility to drivers; the other that driving had become too easy and its externalities were significant adverse factors for society. Numbers – or as time and countless letters proved - absolutely nothing will resolve that but be it at national (probably international), city and local level, the balance is now firmly with the latter view. You are evidently in the former camp.
If I take an example of what I’m sure are many equivalents, both shorter and longer: a friend who lived in Hadley Wood chose to drive daily to Canary Wharf. The large car was private, warm, a space to listen to whatever, and do whatever, in privileged isolation. It was first choice for the individual, even if not being a choice at all for a large minority. It would barrel down Fox Lane (the return journey went a different route I believe). The impact on Fox Lane residents? Mere collateral damage. There’s a perfectly adequate train journey as an alternate, or while taking a tad longer, a cycle ride which my near neighbour here would make to Canary Wharf in about 45 minutes. In both cases there is no equivalent collateral damage. Is that driver so important that we must protect their favoured (shortest) route when perfectly viable alternatives exist? I think not; a lifestyle choice where others pick up their waste; they should preferably get the train but if choosing not to and their journey is now either altered or takes a little longer then I merely shrug.
There is older research which draws a correlation between traffic levels and depth and breadth of community (more traffic is bad) as well as a piece drawing a link between the level of residents’ objections to the level of traffic their street carries (more traffic, more pushback). At 3000 trips per day (below the historic level of many streets in the Fox Lane area) you hit big problems from residents. With Google Maps and Wayz perhaps more previously quieter streets now find themselves in this most-angry category. And it is not something I would wish on anyone. Moving away from our car dominated city is right where London’s transport strategy sits, and car dominated is its terminology.
Freeing our residential streets from others’ externalities brings its raft of more intangible benefits. In the last few weeks I’ve had cause to walk through the City; from Highbury station via Islington to the St Pancreas area; and also from the Holborn area up to Highbury. I have no idea where all the previous traffic has gone, evaporated I suppose, but other than being evidently channelled into a small number of main routes, these areas, once pretty grim, appeared calm and pleasant. No signs of deterioration, closed businesses, angry residents or such, but a peacefulness I realised we don’t get here because things are frequently on edge with its weight of traffic and all that brings. That world is increasingly moving from the city centre, to the inner suburbs and now the outer suburbs – here. I welcome it.
As the recent “Gear Change” report highlighted, it’s not all roses and there is bad as well as good. I would certainly expect residents of the Fox Lane area’s historic low volume / low velocity streets, who until now most likely never saw or experienced a traffic issue, rather upset while keeping through traffic on the boundary roads will inevitable mean more pressure on junctions at peak times, hence tail backs, hence pollution, hence anger and so forth. I have to add that it’s the first time in 30+ years that I’ve heard the call to share the traffic and wonder why it wasn’t being said long since, as if.
It’s taken me five years since realising the direction of things to deliberately move from car to no car and in truth I’m still not feeling fully secure, but the behavioural change as it developed over time has been fascinating. I suspect what we are seeing now is a lot of individual inconvenience – past life has just got a bit trickier as it’s being moved, unchanged, into a new framework. That’s understandable but doesn’t need to be permanent. As the top air pollution expert I’ve mentioned previously said, Brits and their cars are like Americans and their guns. Both societies would be a lot better with a lot less of them.
Disagreeing with the intent of the anti-Fox Lane LTN demonstration as I do, nonetheless I want to add support for the right to demonstrate, a feature of our democracy under real threat from the Governments Police Bill. There are threats and there are threats: LTN’s might be seen as an issue but potentially being jailed for 51 weeks for distributing leaflets to promote a demo against them is not where I think we should be headed. As a society and nation we have much bigger fish that need frying with the energy being expended on LTN’s.
Adrian Day posted a reply
01 Dec 2021 17:03
There was hardly any motorised traffic in the early 1900s, when most streets in the Fox Lane area were built. Look how traffic has grown in London since the 1950s.
Adrian Day posted a reply
01 Dec 2021 17:27
Just to set the record straight, Better Streets for Enfield is not the 'main architect' of local LTNS - these were designed by Council Officers, but we do campaign in favour of well-designed LTNs and want to end high traffic neighbourhoods throughout Enfield (and indeed the country). Many people have fed back their thoughts and supportive ideas to Council officers on LTNs over the past ten years of trials, consultations and initial designs - some of these people are 'members' of the BSfE facebook group - many, many more are not. Members of the BSfE facebook group live in the real world and will regularly see counter-arguments on many other platforms - indeed many who are 'members' of the BSfE group engage daily on twitter, other Enfield community facebook groups, Enfield Dispatch and at public/Zoom meetings. The people who help co-ordinate BSfE's campaigns don't hide their identity - unlike some of those against LTNs.
Hal Haines posted a reply
01 Dec 2021 22:05
As Peter Payne has mentioned my name and made an accusation that I have somehow omitted data as it was inconvenient - here a clarification and answers:

No, I did not do the original analysis of the air pollution. I did the write-up and added an additional Enfield monitoring site (although urban, not roadside) - not for a detailed comparison of Bowes but to show that the spike in November was across the whole of London. I don't think I needed to add anything to part 2 as the piece was primarily about how some people wanted to cherry-pick data (if you look at the "One Community" twitter feed they still are). The second part, a like for like month comparison, found a nearly 29% reduction at the Bowes site. I got a lot of criticism saying how I hadn't taken into account the NO2 reduction over the last decade (which is around 2% a year) showing how that they hadn't bothered to read the article. Some people then showed me graphs including the 2020 figures showing they still want to cherry-pick data. Some peoples idea of averaging was interesting, to say the least - my opinion of a few people fell as a result. As part of the research, I did look at other monitoring sites. I chose the same months and used the same formula to calculate the reduction in NO2 I found the following:

Enfield Prince of Wales 16.45% (this isn't a roadside monitor)
Enfield Derby Road 24.35%
Camden Swiss Cottage 17.12%
Hackey Old Street 24.7%
Haringey Town Hall 5.5%
Kingston Cromwell Rd 15.09%
Southwark A2 Old Kent Road 18.53%
Maidenhead Clarence Rd 27.66% (obviously not in London)

WIth the proviso that I entered all these numbers and haven't triple checked them as I did for the website (TfL did make a mistake with their air pollution table!). I got bored because there are very few monitoring sites and plenty don't have data for all the months I needed. It is very time-consuming finding and entering the data. In any case, somebody would come along and say I am comparing apples with pears! But you can see that a 29% reduction is well above the average. You are welcome to find more sites with the relevant data but I think that stacks up pretty well as it is.
Alan Thomas posted a reply
02 Dec 2021 09:32
Adrian Day wrote:

There was hardly any motorised traffic in the early 1900s, when most streets in the Fox Lane area were built. Look how traffic has grown in London since the 1950s.


Yes, but that's not the point I was making.

I was specifically replying to - and refuting - the statement that "Our streets were never designed and built for motor traffic...".

Clearly, categorically, they were. I cannot understand how anyone could imagine otherwise.
Adrian Day posted a reply
02 Dec 2021 13:32
Built for very little motor traffic - not the thousands of cars seeking to cut through today
Alan Thomas posted a reply
02 Dec 2021 17:32
Adrian Day wrote:

Built for very little motor traffic - not the thousands of cars seeking to cut through today


I'll try again. Is the statement "Our streets were never designed and built for motor traffic..." true, or false?
Peter Payne posted a reply
03 Dec 2021 02:42
As these post become ever more encompassing I’ll tried to consolidate and condense my point of view down and keep this briefer whilst answering recent posts.
Karl I am not in the camp of “all traffic constraints should be removed” but have said repeatedly I am in favour of (continuing) reducing traffic, increasing active travel, including with cycle lanes (where appropriate and positively designed for all movements), but LTNs cannot add to this without increasing pollution and greenhouse gas emissions.

People were sold the idea of LTNs by suggesting private car traffic had increased massively over the last ten years or so and would continue to do so. My post #6271 shows clearly that TfL do not believe this to be the case in London. DfT did not believe this to be the case prior to the one survey (Minor Roads Benchmarking Exercise). All other external data backs up TfLs position. So my question to those promoting the LTNs is who do you believe?

People were sold the idea of LTNs by suggesting traffic will evaporate and things will settle down in a few months. This visibly hasn’t happened in over a year and a half, and my post #6213 shows mathematically why even with substantial or total removal of all available short journeys to other travel can only lead to greater congestion and pollution if you do it by large areas of road closure.

People were sold the idea of LTNs by suggesting there is a lot of evidence that they work and quoted reports such as the Cairns Paper, Waltham Forest report, the Kings report, and several papers by Rachel Aldred and I have shown on various posts on these forums how these are all deeply flawed scientifically and heavily spun so that what is reported is not what they say (#5964, #5973).

People were sold the idea of LTNs by suggesting that because 35% of all car trips are 2km or less that, although some are essential, removal of the 22% that could be actively travelled by fit people will lead to a significantly reduced traffic situation. My post #6246 shows that because the figure TfL doesn’t publicise (that the journeys for the third of cars travelling over 5kms actually AVERAGE 17kms+) this removal will only remove 3% of total traffic. That’s if you removed all available 2km car traffic. This is significant if you do it by education or persuasion but if you do it with large areas of road closure you are squeezing the remaining 97% of traffic onto a smaller road network, hence congestion, pollution etc.

With regards to pollution, apologies to Hal if he didn’t write the reports but I saw his name attached to an earlier one so presumed he had written it rather than just promoted it. I agree there has been some cherry picking on both sides but I thought I personally was being reasonably comprehensive in using YOUR timescales to compare YOUR data to close sites that would have automatically taken into account climatic variables, overall NO2 reductions with time etc. (#6236) which you hadn’t done in the article that Adrian posted on this site.

My concern is primarily with greenhouse gases, and secondarily with pollution so yes I would like to see a reduction in traffic and a speed up of electrification. There are much better ways of achieving this than LTNs which I believe are retrograde, and think I have shown this since nobody has argued statistically or claimed statistically I am wrong.

Karl you have argued the point much more in a general overarching stance and appear at times to have accepted some of the statistical analysis. In many respects I agree with some of what you say in that I am not in the camp of building ever more roads but don’t see the need to close off large areas where this leads to negative net effects to the environment and on people’s lives who genuinely have no alternative. In all honesty, the Fox Lane LTN, has it achieved your goal with respect to the whole community? If it hasn’t do you think it will eventually if it’s allowed to remain?

Referring to above, who do you believe TfL or DfT ?

Here’s the link for a quick check on TfL’s position
content.tfl.gov.uk/travel-in-london-report-13.pdf Page 92
Adrian Day posted a reply
03 Dec 2021 11:08
Traffic and pollution down on roads inside LTN AND boundary roads. More evidence that low traffic neighbourhoods work! news.hackney.gov.uk/rebuilding-a-greener-hackney-homerton-ltn-set-to-be-made-permanent/
Karl Brown posted a reply
03 Dec 2021 13:45
I’ll continue to stay away from statistics in attempting to secure a single catch all answer to LTN’s as is sought; what’s the applied metric for how much better someone feels, and society’s health costs benefit by someone walking more?
You approach a calculation assuming 80% of journeys up to 2km (actually at 2km in your calculated case) are necessary. That’s the distance from PG Triangle to say tube stations at Bounds Green, Arnos and Southgate or alternatively Winchmore Hill. Say 40% or so don’t have access to a car, then of the 60% remaining 80% of those must drive such distances? Is that a sensible position for a less car dominated world to accept?
We can certainly try education but as has been seen with a multitude of sensible advice such as 5 a day, obesity, racism and now wear a mask / get vaccinated, there’s inevitably a me/now barrier for many which blocks change. Smoking is perhaps a decent counter, when education failed ever more stringent controls and price disincentives were employed to force progress.
With stats you are inevitable on tricky ground: Yesterday’s election result: Conservative majority dropped from 19,000 to only 4,000 (“disaster”); or the Conservative vote was above 50% (“wow”). Both true and there’s always the risk of hitting the “I have more legs than the UK average” answer: demonstrably true (in my case) but not really adding to the advancement of anything.
Take the Fox Lane area: 5000 houses / people inside (I’m guessing), 500 on the boundary roads. Say half of the former have experienced little real difference in through traffic from the LTN; 100 on the boundary roads so positioned that they too have only seen change more at the margin. So that’s 2500 benefiting from pollution, 400 perhaps in a worse scenario, a ballpark 6:1 ratio. That’s impressive.
Coming at things from the other extreme, you close off every single thoroughfare and you end up with no (viable) traffic and no traffic related pollution. That’s great on such metrics. Which roads do you then start to reopen and at what acceptable cost?
You say there are much better ways than LTN’s of reducing traffic. I would be all ears, the PM also asked recently for such input. I’m not saying they are the optimal answer but until someone comes along with a better solution to car domination I’ll run with them.
Peter Payne posted a reply
04 Dec 2021 02:37
Karl. Where have I ever said that up to 80% of 2km journeys are necessary? I have never said any 2km car journey was necessary. I have used TfL statistics that 35% of car trips are 2km or less and their own calculation that some of these cannot be removed as they are necessary due to people being unable to actively travel these distances. These include old and disabled people, who may not themselves have a car but are reliant on friends, neighbours and family to get them to appointments or occasionally out of the house for a coffee or a sit in the park. It is TfL who state that the remainder (around 60% of the 2km or less trips, being 22% of all trips) are ones that could be shifted to active travel. I have never commented on the value of these trips and only used the TfL figures stating which are necessary (even though I have noted this 22% never takes into account weather or terrain).

You say you will “stay away from statistics” then proceed in the same post to coddle together some statistics of your own from guesswork to suggest more people have benefitted from improved air pollution than are suffering from it. In doing so you appear to be agreeing that on the perimeter roads the increased queueing traffic has led to increased pollution here, but claim that’s okay because there are more people in the LTN roads that have cleaner air to breathe. My calculations are based on showing there is a net increase overall in both pollution and greenhouse gases. The fact that this net increase is largely concentrated because of congestion makes the situation even more damaging since it’s in these areas the levels can rise quickly to seriously dangerous levels for people with respiratory diseases. That includes residents of your road when they venture out to the perimeter.

You also used statistics in # 6259 when you said “The intro section to the London Transport Strategy 2018, confirmed in 2021, paints a good summary. I think the UK figures go something like 1m+ vehicles in the 60’s, roughly 40m now and one government scenario putting the possible increase at a further 51% by ?DATE?” I have shown you in #6271 that TfL categorically DO NOT BELIEVE THIS but show car traffic on steady decline since 1999 in London. True this is in contradiction to DfT files due to their adjustments in 2018 so I ask you again, who do you believe DfT or TfL ?

Adrian, and indeed any of those out there promoting the retention of the LTN, I would ask the same question. Who do you believe The Dept for Transport who did agree almost totally with TfL until they upped their figures by 20% overnight or TfL who monitor traffic continually, consistently by both counts and large annual surveys who disagree with the adjustments and are backed up by other external data?

Adrian thanks for the link to Homerton and I will look and report back. On a quick glance Mete Coban has fallen into the same trap as I am highlighting above. He says “Traffic in Hackney has risen by 40 million miles a year between 2013 and 2019, according to Department for Transport statistics,”. Now if someone in his position doesn’t know that TfL do not believe this what hope is there? Now it is likely he does know but is putting the usual political spin on it. At first glance it looks pretty similar to the Waltham Forest spin (see #5964) saying traffic counts are cars (not true if you count a car passing through an LTN on three different roads and once on a perimeter road), by not counting beyond the immediate perimeter roads, etc.
With respect to pollution he has claimed the pollution has fallen on perimeter roads as well as within the LTN yet he is comparing annual average figures pre covid (2019) with annual figures during lockdown year(2020). Of course they have fallen. It would be ridiculous had they not fallen, er.. except one didn’t fall. Despite an overall drop in the air pollution levels everywhere this one stayed the same. This represents a large net increase here and where is it? Outside Homerton Hospital which deals mainly with childbirth and obesity so I guess pregnant Hackney women are really happy with the congestion and dirty air here. Didn’t Mete mention where it was? I guess he just forgot.

One other line that jumps out, he says “Overall, 37% of Commonplace responses wanted all or some of the filters to be made permanent, with 62% saying none should be made permanent.” So 62% were against completely but he’s lumped together those that were fully in approval with those that clearly objected to at least some of the barriers, but of course we don’t know actually how many were fully in approval. My guess is that he hasn’t told us because it’s an embarrassing figure. This is typical of the reportage that happened in the Walthamstow Village Report.

If one can see all this in a scant read of his own carefully worded press release I fear it will be Walthamstow like in it’s spin but will have to reserve judgement until the full report is released. I dare say Councillor Barnes is taking notes in how to get those elastic bands really wound up tight.
Karl Brown posted a reply
05 Dec 2021 13:56
Peter, apologies if I misunderstood but my logic says that if you were basing your argument on 20% of a set of journeys being not required then by implication the remaining 80% become required.
Your case, as I’ve already said, seeks to prove – claims to prove - all LTN’s, and by extension all road closures, being to the detriment of steady state aggregate traffic distance are negative and should not be in place. It’s a view.
I put forward a two minute counter “proof”. Tune the assumed numbers to correct and the good / bad ratio will still be overwhelming when applied to pollutants (noise and PM’s in this case). I’m not promoting it, simply highlighting numbers have many dimensions and neither calculation is likely to pick up either the Frank Medal or a Nobel Prize in Economic Sciences.
TfL or DoT? Not something I’m looking at but I assume both have supportable sampling techniques based on specified assumptions. DVLA is presumably a good source for absolute vehicle numbers; and ANPR should be capable of providing quality data for determining driven miles and associated trends. Whatever the answer we have an examined, agreed strategy in London to reduce car domination and a government set on rolling out LTN’s. I don’t think the long campaign to blame, and in some quarters to belittle, Ian Barnes is community-helpful against such a framework.
The whole borough is an Air Quality Management Area (as I think are all nearby boroughs). Enfield’s resultant focus is based on traffic and seeking a move to active travel (walk, cycle, public transport) where they say we all have a role to play. So I’d say for those sitting in cars feeling forced to have an extra minute or more added to their journeys and feeling how unjust it all is and in some case just how incrementally polluting they believe it to be, to instead to focus on considering do they really need to be there in the first place, at least each and every time, and then with the engine running Whatever the answer I don’t believe it is going to be going along with 3-4000 vehicles per day bashing through Amberley and equivalent streets for their personal convenience.
If you don’t mind I’m going to end this one, I think we’ve explored and made points and it now taking a lot of space on a subject where a report is close to decide a future.
Peter Payne posted a reply
08 Dec 2021 00:33
Karl, just to clear a few things up as I appreciate that you wish to bring this one to an end, and I do appreciate you taking the time to debate as opposed to others (Adrian ? Hal? Basil?) who simply stay silent when they cannot back their position up with counter statistics or evidence. And of course those who never enter into the debate (Sarah R. Oliver B. Ian B. etc.) . To finish then I’ll just clarify what you have brought to attention in the last post.

The 20% figure (actually 22%) is of the short journey traffic (35% @2km or less) and is not my figure but TfL’s. So if anyone is inferring the remainder are necessary it is them. Clearly some of the next third (2-5km) may also be deemed unnecessary to be driven but you have to eliminate walking as an alternative for most of these which leaves cycling as the only active alternative. By the time you get to the top third very few of these are ever going to be cycled so Public Transport is the only alternative. The problem is this top third averages 17km, according to TfL and constitutes well over 80% of the traffic on the road.

Your two minute counter proof does not counter at all. My argument is that the LTNs, even with maximum possible traffic evaporation of short journeys (which they are apparently designed to encourage) will only increase net pollution and greenhouse gases which, I’m sure you agree, we shouldn’t be doing. Whereas your counter proof just says this is okay since all this extra pollution is affecting a smaller amount of people (who already have more pollution and traffic anyway) than are benefitting. Firstly you are only taking into account boundary roads where the congestion/pollution is way beyond these roads anyway. Secondly you are not taking into account that the pollution is concentrated around the queueing traffic so these roads are experiencing much higher and potentially asthma attack inducing levels where if the traffic were spread more evenly these levels would not be reached. Thirdly the residents of the LTN still experience these concentrated levels whenever they walk or cycle beyond their private enclosure. Fourthly the net increase in Greenhouse Gases affects all of us where ever we live.

You say you are not promoting it but by suggesting it you show you are comfortable with the “I’m alright Jack” approach which is dividing the community. If you truly want to counter my statistical argument you need to prove my statistics are in error with either better sourced statistics or an error in maths or logic, not invent an unrelated proof. If your proof were true it still doesn’t disprove mine but they would co-exist which means there is more congestion and pollution but that’s okay because there are less people on boundary roads, who already experience more pollution anyway, than are inside so it doesn’t matter.

Ultimately the question still remains is what has happened to the 3-4000 cars that used to “bash down Amberley and other roads” ? Have they, or any significant proportion of them, evaporated as we were promised, or at least you believed they would. Or are they, a year later, on alternative routes on the boundary roads and beyond? If the 3% of the total traffic (that’s if we had 100% success at evaporating short journey traffic) that could disappear (according to TfL) actually disappeared, would we not still have the congestion we see virtually every day, since the 97% that remains is now concentrated on fewer roads? Do the 3-4000 vehicles who used your roads for their “convenience” have to now drive longer, both in time and distance, queue and crawl not for “one or more minutes” but often for eight to ten minutes, for your convenience of not having them drive down your roads?

Adrian, who do you believe TfL or DfT ?
Adrian Day posted a reply
08 Dec 2021 15:56
If you look through the past year you'll see I have engaged with you countless times - I simply dont have the time to engage in further debate with your endless questioning of every assumption and stat even when they are supplied by full-time academics and bona fide research studies. For your information Oliver no longer lives in Enfield and Clare campaigns fulltime for LCC so is hardly going to spend her spare time engaging with your endless tomes. You ask what I believe? I believe traffic flows have increased in London and Enfield over the past 30 years, I believe volumes of traffic have increased on unclassified roads in Enfield thanks to digital way-finding apps and I believe that low traffic neighbourhoods are an effective way of dramatically reducing that through-traffic for residents and improving their quality of life. I also believe that ltns encourage people to think about their travel choices and encourage them to walk, cycle or use public transport rather than drive short distances when they can - and I believe that along with road-pricing, cycle lanes and improved public transport ltns lead to behaviour change. I see and hear evidence of this every day in Enfield's two ltns. I'm hugely encouraged that central, regional and local government policy makers and politicians see this as the way of the future - just last night Haringey approved three trials ltns which is fantastic news.
Adrian Day posted a reply
08 Dec 2021 20:16
Alan Thomas - False
Paul Dick posted a reply
09 Dec 2021 09:05
Hi Peter,

"This visibly hasn’t happened in over a year and a half, and my post #6213 shows mathematically why even with substantial or total removal of all available short journeys to other travel can only lead to greater congestion and pollution if you do it by large areas of road closure."

I'm late to the debate. Can you explain if the other travel is walking, cycling or using escooters how this will lead to greater congestion and pollution. Mathematically you must admit removing 30 cars from a short journey and putting those 30 cars worth of passengers into a bus would reduce congestion and pollution.

Regards,
Paul.
Alan Thomas posted a reply
09 Dec 2021 11:52

You appear to be contradicting your assertion from post #6284:
Adrian Day wrote (message 6284) :

Built for very little motor traffic...


Up to now I've tried to be an LTN agnostic, as I see merits and demerits on both sides. But if siding with the pro-LTNs means aligning myself with people who want to assert that the majority of the roads in the Fox Lane LTN - built in the Twentieth Century no less - "were never designed or built for motor traffic..." then I'm afraid you've just lost a potential supporter.

This is Flat Earth Society level stuff.
Adrian Day posted a reply
09 Dec 2021 15:11
Fox Lane streets were built between 1904 and 1914. The vast majority of people walked, cycled, used horse and cart and public transport. Total car ownership in the UK was 100,000 in 1910 - today its over 39 million vehicles. So the car was the exception - as these pictures from that period show and the street designers didn't have a crystal ball. Indeed it was designed as a very low traffic neighbourhood - bliss!
Alan Thomas posted a reply
09 Dec 2021 16:27
Adrian Day wrote (message 6296) :

Fox Lane streets were built between 1904 and 1914. The vast majority of people walked, cycled, used horse and cart and public transport. Total car ownership in the UK was 100,000 in 1910 - today its over 39 million vehicles. So the car was the exception - as these pictures from that period show and the street designers didn't have a crystal ball. Indeed it was designed as a very low traffic neighbourhood - bliss!


You illustrate your point with photographs of the very roads I pointed out *were* indeed evolutions of muddy, bucolic country lanes. Aldermans Hill, Green Lane(s), Bourne Hill/The Bourne and Fox Lane are not the roads that were built between 1904 and 1914, and now part of the Fox Lane LTN, that we are discussing.

I insist that the majority of roads within the Fox Lane LTN *were* designed and built with motorised traffic in mind. They were built as Tarmacadam roadways with services running underneath them, with paved walkways along both sides and raised kerbs separating the two. No crystal balls necessary; the planners and developers had seen what was coming.

Yes, of course they could not imagine the huge increase in private car ownership and the level of (over) use seen a century later, but that's another point altogether. They probably never imagined the UK population would double either.

The street I live on - inside the Fox Lane LTN - never evolved from an ancient track or medieval pathway. It was built from scratch, on what had been farm land, in the Twentieth Century - the century of personal motorised transport.
Adrian Day posted a reply
11 Dec 2021 10:21
Built from scratch but not as a high traffic neighbourhood for thousands of cars to cut through every day. Which is why a low traffic neighbourhood is needed. Here’s newly built Derwent Road - with no motor vehicles and a horse and cart.
Alan Thomas posted a reply
11 Dec 2021 11:05
Adrian Day wrote (message 6298) :

Built from scratch but not as a high traffic neighbourhood for thousands of cars to cut through every day. Which is why a low traffic neighbourhood is needed. Here’s newly built Derwent Road - with no motor vehicles and a horse and cart.


What, no cargo bicycles? No rosy-cheeked children playing hopscotch in the middle of the road? And where is Jean de Manios's Bleriot on the roof of No.75...?!

You seem to be keen to affirm something that I do not dispute. Yes, we have too many motor cars. But we also have too many people, and those people are not living simple, uncomplicated, Edwardian lives.

Personal motorised transport brought great freedom. We now need to rein it in a little (offering sensible and practical alternatives) but those who are nostalgic for empty streets and the occasional horse and cart might still be glad that they have the use of an MRI scanner when required. Even Luddites need to be pragmatic.
Peter Payne posted a reply
16 Dec 2021 16:50
Hi Paul
In response to #6294 I’m guessing you didn’t read the post #6213 which explains exactly how removing all short journey cars to active travel or public transport will lead to more pollution, if you do it by closing large areas of roads. If you do it by persuasion or other means there would be a saving in pollution but the additional congestion, delays , longer journeys both in length and time caused by squeezing the remaining traffic onto a smaller road network leads to a net INCREASE in pollution and greenhouse gases.
To make it easier to follow I’ll put a diagrammatical post up under a new thread, “LTNs Will Increase Pollution and Greenhouse Gases”

Adrian. In response to #6292. Yes you have engaged but not countered any of the statistics I have supplied. You haven’t disproved the maths or logic so I’m guessing you cannot. If I “question every and stat supplied by full-time academics and bona fide research studies” it is because they are questionable. Have you actually read any of these papers or are you just relying on summaries and conclusions spun by various lobby groups ?

For example Rachel Aldred’s paper quoted in Richard Eason’s Bowes QN (LTN) Report on the effects of LTNs. Of her sample population nearly 30% were drawn from London Cycling Groups. This over represents the opinions of cyclists by about a factor of ten times since, in the same paper, she quotes “only 3% of the Outer London Borough population cycle 3 times a week”. In a longitudinal survey where you are relying on people to fill in a diary of walking, cycling and car activity, is this really a representative sample from a fair minded, objective statistician? As a result of this bias towards cyclists she has also hugely under represented the BAME community since her sample population were 89% white where the general population in Outer London is around 65% white. So the BAME community’s input/opinion is diluted to a third of what it should be.

In addition, her paper is littered with figures where the p value is <0.5 where statistically this makes them unreliable as they cannot rule out the Null Hypothesis, meaning they could be just random events. Despite a small percentage increase in cycling from a very low base, she had to also conclude “No evidence either way of change in car use associated with interventions”. You tend not to read these conclusions from LCC or BSfE or even from TfL who funded it.

If you only want to listen to academics then in personal communication to me from Rachel herself…
“I agree that with the figures we have re motor traffic in Waltham Forest, we can’t draw strong conclusions about impacts of the Village scheme on motor traffic flows on boundary roads.”

And when questioned about relating her survey on the LTN effect on the fire service to emergency vehicles in general…..
“London Ambulance Survey data unfortunately is not granular and spatial like the fire brigade data, so we weren’t able to use that in the same way.”
In other words they didn’t look at the effect on the Police or Ambulance service because it wasn’t easy. Or if they did they didn’t report it. These emergency services operate in a different way with “nearest responder” so don’t have the local knowledge of the Fire Brigade.

With respect to the effects of LTNs on cycling and whether they work at all Rachel says…..
“In terms of health benefits – I mainly see LTNs (if they work) as improving health by increased walking – I think this would be the main pathway.”
Note the “IF THEY WORK”

If Oliver no longer lives in Enfield how come he is still commenting on BSfE and still appears to be an administrator ?

In your belief that “ traffic flows have increased in London and Enfield over the past 30 years” you are clearly disagreeing with “full time academics and bona fide research studies” of Transport for London.
I agree that digital way finding apps will have led to an increase in traffic on some minor roads where these would largely have depended on local knowledge, but is the solution really to close all these roads and increase pollution and Greenhouse Gases as a result ? Surely a better way would be to legislate that these companies algorithms cannot show an alternative route through residential areas unless there is a substantial (20%?) saving of journey time.

You and anyone else are free to give up their car if they don’t need it. Others may be persuaded to do so also, or use the cars they have less, but you can still do this without the LTNs which are causing those that have to drive to increase pollution against their will. Road pricing might work but for a left of centre person like myself this is just an admittance that ultimately only rich people will be able to drive and those poorer people who rely on their car will have to lower their standard of living elsewhere to continue to work. There are better ways of reducing traffic, and pollution in particular.