
 A coalition of more than twenty campaigning groups is calling on candidates in next month's council elections to commit to taking steps to reduce the number of miles driven by diesel and petrol cars in London in order to improve air quality, reduce deaths and injuries and increase physical activity
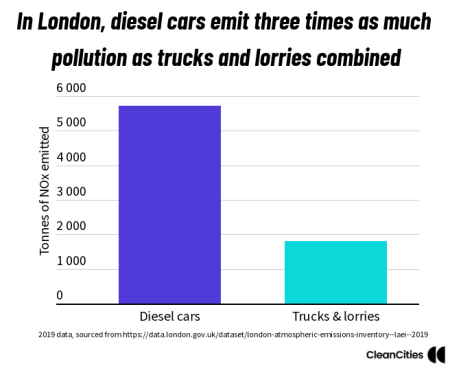 A press release issued by Clean Cities reveals that its research shows that pollution from diesel cars alone is estimated to be three times worse than that from heavy goods vehicles (HGVs) across London. The latest official data shows that diesel cars contribute 5,717 tonnes of nitrogen oxide (NOx) emissions compared to just 1,808 tonnes from HGVs. This has shifted over six years: 2013 data showed that HGVs emitted a similar level of NOx emissions as diesel cars (5,818 tonnes vs 5,727 tonnes).
| NOx emissions (tonnes/annum) in GLA boundary | 2019 | 2016 | 2013 |
|---|---|---|---|
| Road Transport (total)* | 15,492.3 | 22,477.3 | 26,147.5 |
| Car – Diesel** | 5,716.5 | 6,189.7 | 5,818.2 |
| Car – Electric** | – | ||
| Car – Petrol** | 1,217.6 | 1,917.3 | 2,950.1 |
| HGV – articulated | 506.7 | 1,222.7 | 1,939.0 |
| HGV – rigid | 1,300.9 | 2,859.5 | 3,787.9 |
| LGV – Diesel | 4,048.7 | 4,353.3 | 3,849.9 |
| LGV – Electric | – | – | |
| LGV – Petrol | 5.6 | 27.6 | 41.2 |
| Motorcycle | 71.3 | 85.2 | 103.5 |
| Non-TfL Bus / Coach | 1,150.5 | 2,378.0 | 3,066.4 |
| Taxi | 665.1 | 689.1 | 672.9 |
| TfL Bus | 809.5 | 2,754.8 | 4,370.1 |
*total may differ slightly owing to rounding
**includes Private Hire Vehicles, which became a unique category in 2019
2019 data. Source: https://data.london.gov.uk/dataset/london-atmospheric-emissions-inventory–laei–2019
Percentage of road transport NOx emissions from diesel and petrol cars in 2013, 2016 and 2019
| Borough | 2013 | 2016 | 2019 |
|---|---|---|---|
| Barking and Dagenham | 34% | 37% | 42% |
| Barnet | 39% | 41% | 46% |
| Bexley | 39% | 42% | 47% |
| Brent | 35% | 36% | 44% |
| Bromley | 42% | 45% | 52% |
| Camden | 26% | 28% | 29% |
| City of London | 12% | 13% | 11% |
| City of Westminster | 17% | 18% | 20% |
| Croydon | 38% | 41% | 49% |
| Ealing | 35% | 36% | 43% |
| Enfield | 34% | 39% | 46% |
| Greenwich | 32% | 35% | 42% |
| Hackney | 26% | 28% | 34% |
| Hammersmith and Fulham | 29% | 30% | 38% |
| Haringey | 31% | 33% | 43% |
| Harrow | 46% | 49% | 54% |
| Havering | 35% | 40% | 45% |
| Hillingdon | 40% | 43% | 48% |
| Hounslow | 40% | 41% | 45% |
| Islington | 24% | 26% | 28% |
| Kensington and Chelsea | 22% | 23% | 31% |
| Kingston | 44% | 45% | 51% |
| Lambeth | 25% | 28% | 35% |
| Lewisham | 31% | 33% | 42% |
| Merton | 37% | 40% | 46% |
| Newham | 31% | 32% | 40% |
| Redbridge | 40% | 41% | 48% |
| Richmond | 42% | 43% | 48% |
| Southwark | 25% | 28% | 34% |
| Sutton | 43% | 46% | 54% |
| Tower Hamlets | 27% | 28% | 34% |
| Waltham Forest | 37% | 39% | 45% |
| Wandsworth | 32% | 35% | 41% |
| GLA average | 34% | 36% | 43% |
Source: https://data.london.gov.uk/dataset/london-atmospheric-emissions-inventory–laei–2019
Clean Cities press releases
#CleanAirWins: Bikes, buses and bye to diesel. London 2022 candidates, will you step up?
Diesel cars in London cause three times as much pollution as trucks and lorries
Both press releases are fully referenced